Red Listing and Indicators
In the past, species’ status was often assessed on expert opinion, or by counting the number of occupied grid cells. Our recent work has used computer simulations of the recording process to inform how we can estimate the trends in species status over decadal timescales. BRC is working with recording schemes, government agencies and partner organisations to derive quantitative trend estimates and other metrics for use in Red Listing and the development of biodiversity indicators to assess the 2020 ‘Aichi targets’.
Building upon earlier atlases, trend estimates were presented in recent atlases for ladybirds (2011), hoverflies (2011), dragonflies (2014) and bryophytes (2014). We continue to work with recording scheme experts to extend the availability of trend information to a much wider set of species groups. The State of Nature Reports (2013 & 2019) to which BRC contributed trends for over 1,000 species, highlighted declines in UK wildlife. The Priority Species Indicator tracks changes in the status of over 200 species of conservation concern.
Growth in threatened species status assessments
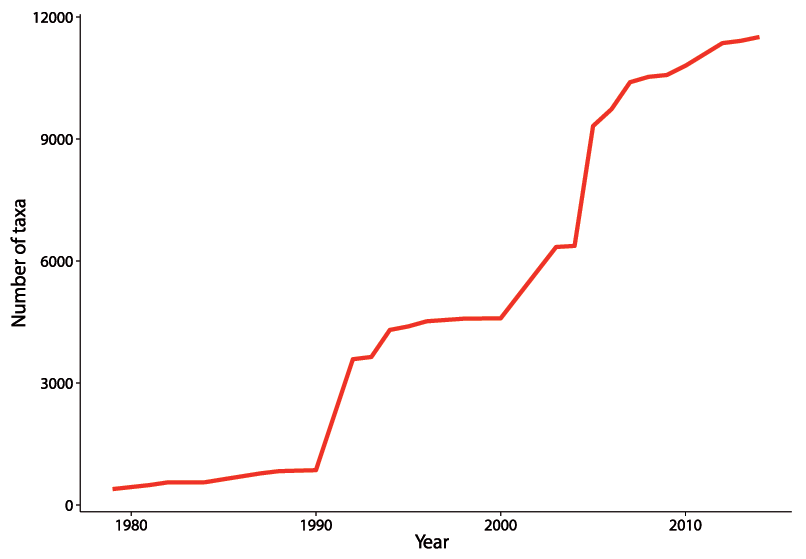
Figure: Nick Isaac, CEH.
The cumulative number of UK taxa (species and subspecies) that have been formally assessed against criteria for conservation prioritisation.
Provisional extinction risk assessment of 1026 species using biological records.
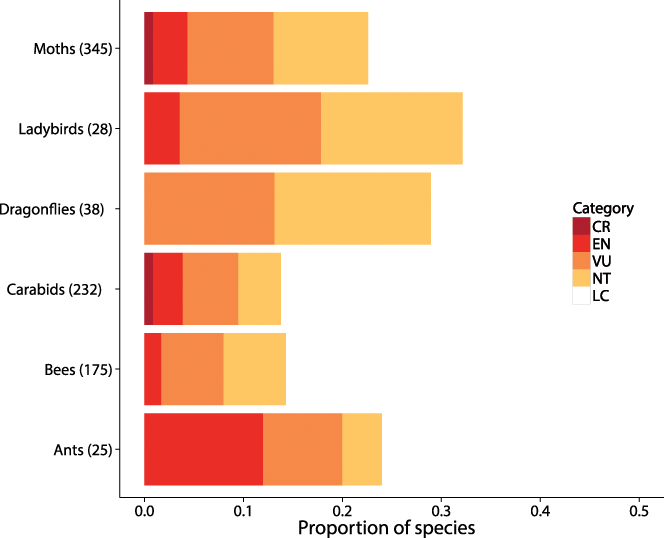
Figure: Nick Isaac, CEH
Species were assessed against IUCN criterion A2c, based on rates of decline in frequency of occurrence since 2000. The categories are Critically Endangered (CR: >80% decline), Endangered (EN: >50%), Vulnerable (VU: >30%), Near Threatened (NT: >20%) and Least Concern (LC: stable or increasing).
The Priority Species Indicator, using biological records
Photo: © JNCC
For the first time in 2013, the UK Government published a biodiversity indicator based solely on opportunistic biological records data. The indicator included ~230 insects (mostly moths & bees) listed as conservation priorities by the four national governments of the UK.
Sophisticated statistics make it possible to estimate quantitative measures of species’ trends (IUCN criterion A) and range size (criterion B) using biological records. In doing so, these models make a number of assumptions about how the data are collected. As analytical tools become more widely adopted, our challenge is to harmonize how criteria are applied across taxa and regions. Clear guidelines are needed to resolve conflicts between model results and expert opinion in order to provide robust species trend information.
References
| 145 | (2013) C4. Status of threatened species. JNCC, |
| 421 | (2011) A new Red List of British butterflies. , |
| 529 | (2011) The development of butterfly indicators in the United Kingdom and assessments in 2010. , |
| 424 | (2010) A revised list of nationally rare bryophytes. , |
| 360 | (1999) British Red Data Books: 1 Vascular plants (3rd edition).. Joint Nature Conservation Committee, Peterborough |
| 362 | (1991) British red data books: part 3: invertebrates other than insects. Joint Nature Conservation Committee, Peterborough |
| 361 | (1987) British Red Data Books: 2 Insects. Nature Conservancy Council, Peterborough |
| 359 | (1983) British Red Data Book, volume 1: Vascular Plants. Royal Society for the Conservation of Nature, Lincoln |
| 141 | (1977) British Red Data Book, volume 1: Vascular Plants. Society for the Promotion of Nature Conservation, Lincoln |